Understanding Trade Analytics: Net P/L, Win Rate, Drawdown and More
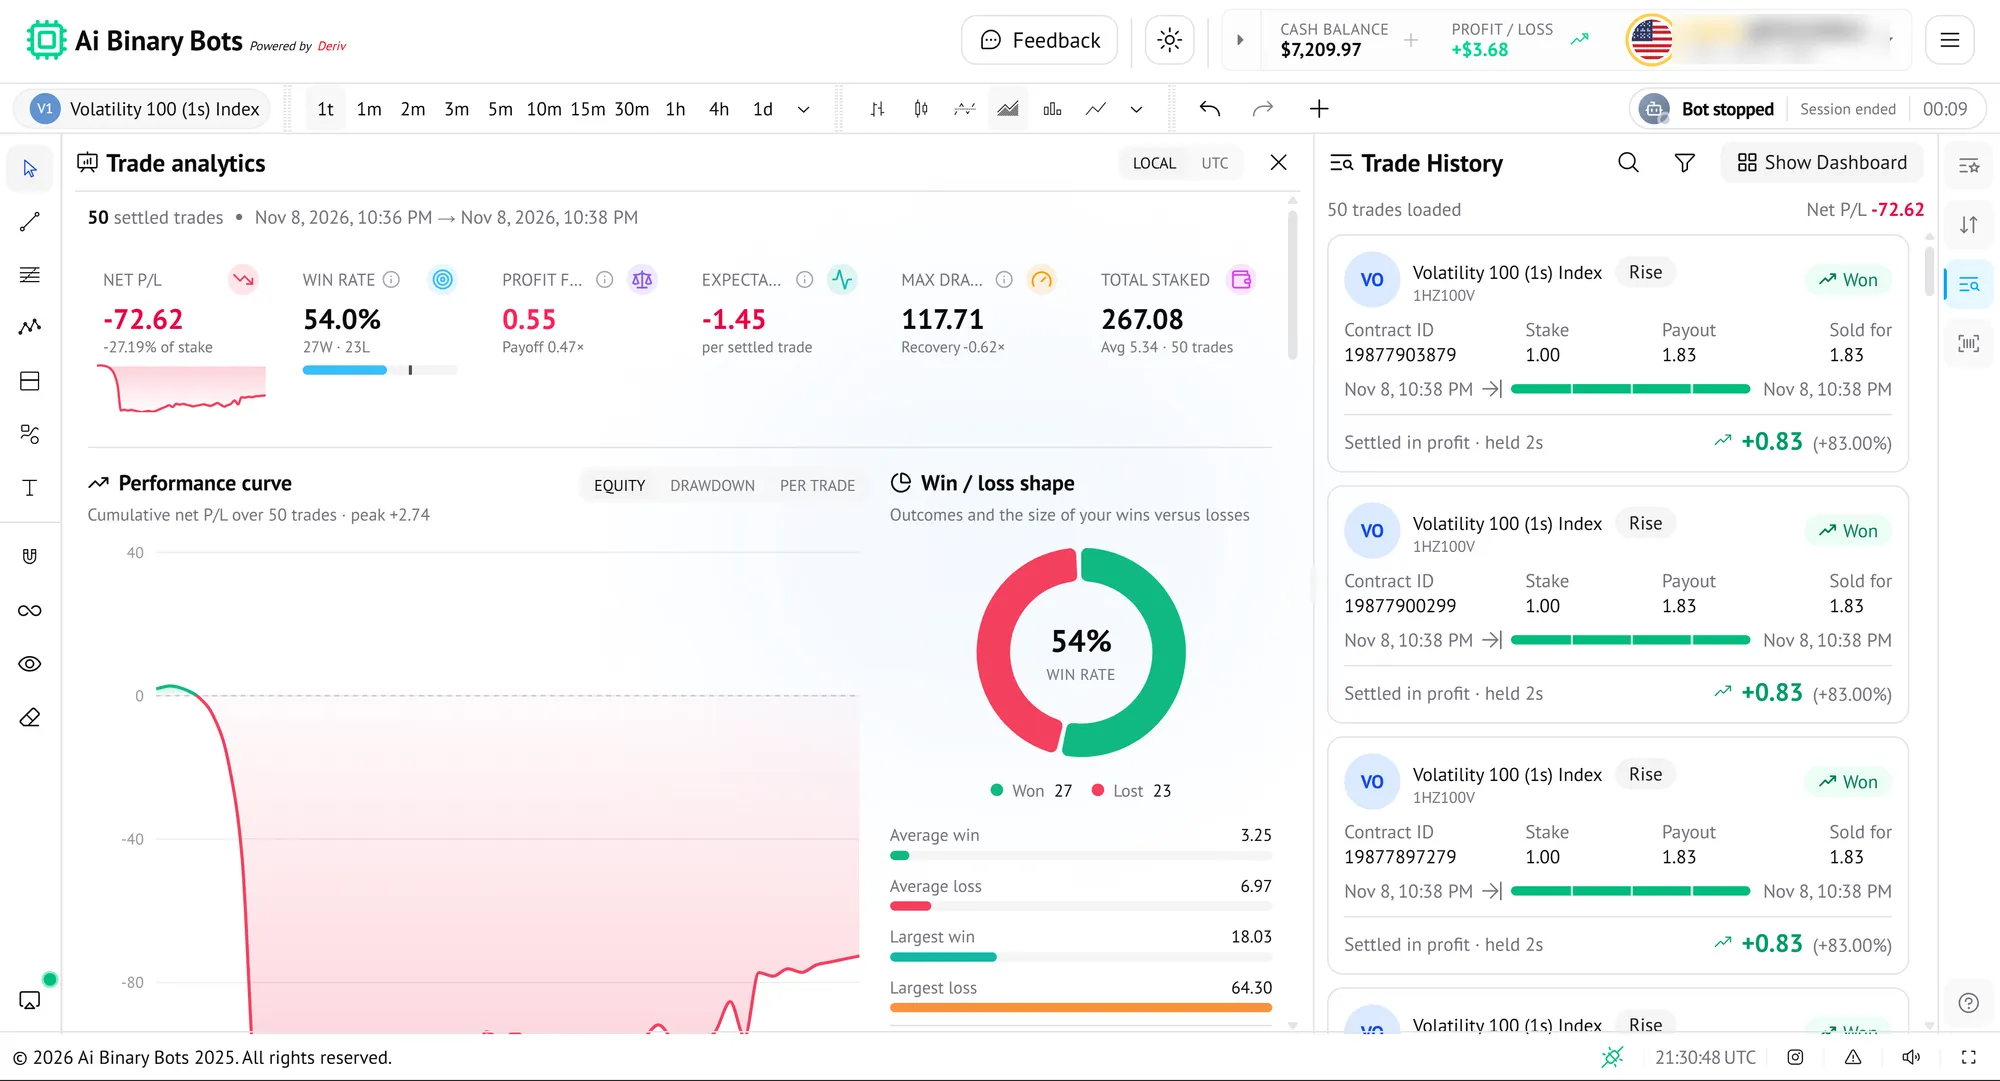
Trade analytics summarises your settled trades in one view. This guide explains each metric and uses a real example where a 54% win rate still lost money.
Last updated:
The headline metrics
| Metric | What it tells you | How it is worked out |
|---|---|---|
| Net P/L | Total profit or loss, also shown as a share of your stake | Sum of all settled results |
| Win rate | How often trades win | Wins ÷ settled trades (27W · 23L = 54%) |
| Profit factor | Winning money compared with losing money. Below 1 means losses outweigh wins | Gross profit ÷ gross loss |
| Expectancy | Your average result per settled trade | Net P/L ÷ number of trades |
| Max drawdown | The biggest fall from a peak in your running result | Largest peak-to-trough drop |
| Total staked | Money put into trades, with the average stake | Sum of stakes |
Metrics in Trade analytics and what they mean.
Deriv defines drawdown as a measure of how risky an investment is by looking at how much it goes down, from its highest value to its lowest, and profit factor as a comparison of total profit from winning trades with total costs from losing trades.
Reading the example: why 54% can still lose
In the screenshot above, 27 of 50 trades won. That sounds good, yet the session lost money. The numbers explain why:
| Number | Value | What it shows |
|---|---|---|
| Win rate | 54.0% (27 won, 23 lost) | More wins than losses |
| Average win | 3.25 | Small wins |
| Average loss | 6.97 | Losses are about twice as large |
| Payoff | 0.47× | Average win ÷ average loss (3.25 ÷ 6.97) |
| Profit factor | 0.55 | Winnings were about 55% of losses |
| Expectancy | −1.45 per trade | −72.62 ÷ 50 trades |
| Net P/L | −72.62 (−27.19% of stake) | Total result |
| Max drawdown | 117.71 | Largest fall from a peak |
Numbers from the example session.
Win rate is only half the story
Because binary payouts are below 100% of the stake, and some staking strategies make losses larger than wins, a win rate above 50% does not guarantee a profit. Always read it alongside average win, average loss and profit factor.
The performance curve and win/loss shape
- Performance curve plots your cumulative net P/L across trades. Switch between Equity, Drawdown and Per trade views.
- Win/loss shape shows a win-rate ring and the size of your wins against your losses: average win, average loss, largest win and largest loss.
Use the drawdown view and your largest loss to check that your stop loss and stake size are realistic.
A quick checklist
- Is expectancy positive, or are you losing on average per trade?
- Is the profit factor above 1?
- Is the max drawdown something you could live with on a real account?
- Is your largest loss far bigger than your average loss? That can be a sign that a progression strategy is climbing.
Practise on a Deriv demo account before you use real money.
Get StartedFrequently asked questions
- What is a good win rate?
- There is no single number. A win rate only means something with your average win, average loss and payouts. The example above won 54% of trades and still lost money.
- What does a profit factor below 1 mean?
- Losing trades cost more than winning trades earned, so the session is in loss.
- What is max drawdown?
- The largest fall in your running result from a previous high point to a later low point.
Keep reading
- Statement and trade historyAI Binary Bots keeps two records of your activity: Trade History for each trade, and your Statement for every transaction and your balance. They answer different questions.
- Stop loss and take profitA stop loss is the most you are willing to lose in a session. A take profit is the gain you are aiming for. Setting both before you start is one of the simplest ways to keep a bot inside your plan.
- Which staking strategy should I use?Compare all 15 strategies side by side with links to each guide.
Sources
Risk warning: Trading binary options involves a high level of risk and you could lose your entire stake. Only trade with money you can afford to lose. This page is educational and is not financial advice.